How React 18 Helps to Create Best Financial Dashboards
20th July, 2022
Every business needs to adopt tips, tools and tricks that would let them grow. There can be no compromises when it comes to analysing your business, and you need the best tools for it. This is where financial dashboards come in. Combine financial dashboards with data visualization and you have a great team that brings out the hidden nuances within the metrics, including correlations between metrics you never knew existed.
Why Financial Dashboards
A financial dashboard is a critical element in any business, large corporation, a non-profit, or a small independent business. Through these, they can track KPIs or Key Performance Indicators in real time. There is no doubt, you will have a team or an individual working on the financial aspects and generating reports, mostly quarterly ones. It is easy to generate the reports, but once it comes to the comprehending part, things could get mushy. Dashboards display data in different formats, through graphs, charts, bars, columns, etc. and understanding these and making sense of them are critical to businesses in achieving business goals. Every business relies on these financial dashboards to succeed.
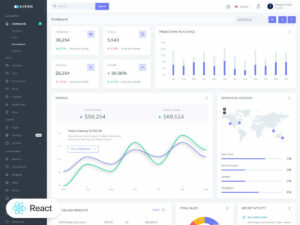
There are several pre-built financial dashboards that you can download, or you can go for the customized ones as well. Both are critical in tracking the different KPSs. There are different kinds of financial dashboards depending on the industry you belong to, but they generally have Sales Management Dashboards, Wealth Management Dashboards, Investment Portfolio Dashboards and Marketing Dashboards.
Sales Management Dashboards are used for analyzing sales stats. Through this you can access and analyze all the data that’s related to the sales aspect of the company from different sales locations, product categories, performance of the employees, their progress and contributions, the data collected over the years.
By looking at the Wealth Management Dashboard, businesses can manage their wealth, by tracking the distribution of their financial assets, and analyze how they have performed over the years. The KPIs for this would be revenue, new net money, sales etc.
Through the Investment Portfolio Dashboard, you can analyze the investment distribution in different geographical areas, and the risks associated with them.
To know how your marketing efforts have paid off, just look at the Marketing Dashboard over the months, and check if you’ve reached your goal, the leads and traffic that’s grown, etc.
The Principles For Creating Financial Dashboards

The graphs and charts matter – One of the important factors of your financial dashboards is the graphs and charts that go with them. It is important to choose a chart that is easy and functional, not just beautiful anymore. Analyze the metrics important for your business, and choose visual indicators that drive results.
Make optimal use of negative space – Clutter is one thing that makes your dashboards look distracting and repulsive. It is important to create an easily comprehensible dashboard to help draw attention to the most important metrics.
Dashboard that doesn’t require a middleman – The dashboard doesn’t require a middleman to explain the metrics to you, it must be self-explanatory and the information easily understandable.
Constant monitoring – Dashboards must be monitored closely so you can make ongoing adjustments. Set a period of time, like a cycle and follow it so your dashboard grows along with the company.
Building Financial Dashboards with React 18
Released in March 2022, React 18 is all about performance improvements and a super efficient rendering engine. There are several new features in the Javascript UI library that have already made it extremely popular. It sets the foundation for concurrent rendering APIs, plus other features that will be discussed while talking about building financial dashboards.
Financial Dashboards need a great deal of research, planning and some amount of coding, making it a complex project that requires an excellent programming language. With its out of the box components, React 18 is definitely the right choice.
Creating The Best Financial Dashboard Can Drive Your Business
Since every business is different, the dashboard also varies with what main KPIs you are targeting. It could be Gross Revenue, Gross Profit and Net Income or any other KPIs that could be valuable to your business. So you need to know what the key business metrics are with relation to cash flow, sales pipeline, customer retention, customer satisfaction, etc.
Here are some simple features that can make those dashboards the best choice for businesses.
Like a story – Dashboards are like stories because you prioritize the graphs and use a great presentation style that not only shows patterns, but are self-explanatory as well. The graphical view provides game changing insights that makes it easy to understand.
Excellent customization options – Financial dashboards offer excellent customization options to highlight key findings. Labels, titles, annotations, you can do it all with dashboards.
Suitable for all kinds of businesses – Whether it is a product based business or service-based business, a dashboard is the answer to track useful KPIs. Identifying the trends and understanding customer interests would help match demand, and help you reach business goals faster. The key KPIs will tell you if you are heading in the right direction from different perspectives – customers, human resources, internal processes.
Gives you a real-time pulse of the company, understands what the current priorities are, and helps the decision makers to embrace best practices for financial management.
The Features That Makes React 18 The Ideal Choice
React 18 is a great resource for creating financial dashboards. This platform helps create highly responsive, accurate dashboards that would take your business to the next level. Here are the main features of React 18 that you can utilize to create super efficient dashboards
1.Concurrency Helps to Interrupt Rendering
Before React 18, it was not possible to interrupt, pause, abandon or even resume a render. But with the new version, it doesn’t matter if you were in the midst of a heavy rendering task, you can interrupt and pause whenever you want it.
Through this feature, react 18 creates multiple versions of the user interface simultaneously. This opens up new avenues to improve app performance.
2. Automatic Batching
Batch processing of large data sets is important because the data is collected from multiple sources. When this happens automatically it becomes faster and more efficient because it helps in reducing the number of re-renders for each time a state change happens.
Batching helps in better computational performance. It is nothing complicated, but grouping multiple state updates together so they become a single render state is not easy either. Automatic batching helps in solving certain problems that were present in the earlier versions of React 18. In the previous versions, batching was only for React handlers, and in the present version, this issue is resolved by adding automatic batching. React 18 comes with Root API that would do all the automatic batching, irrespective of where they originated from.
3. Transitions
Not all the data collected through financial dashboards require urgent updates. Transition is an interesting concept that would help you distinguish between urgent and non-urgent updates.
Sometimes, when you perform heavy operations, the app could become unresponsive. React’s startTransition API solves such situations, and will interrupt only when there are urgent updates. The API has the capacity to identify between slow updates and the emergency ones, and keeps the app responsive during updates. If, during the transition, you interrupt the process, React will discard the incomplete rendering work, and proceed with the latest update only.
4. Server Rendering
React 18 comes with interesting features like (1) Code splitting on the server and (2) Streaming rendering on the server so the user doesn’t have to wait anymore for the content to display or for the interactivity to kick off. Through the server rendering feature, the user doesn’t have to wait, and stare at the blank screen anymore. They can view some UI while the JS bundles are in the loading stage. Most developers would tell you that before React 18 was used, this was the main part where bottlenecks usually occurred. Server rendering has made the process faster, reducing the time for the interactive feature of the application to present itself. This is a very important feature because even one component can slow down the app considerably.
Final Thoughts.
Building financial dashboards with React 18 is super easy and an excellent move. You need a team of experts to get the ball rolling, to build the right kind of dashboard. Interactive and customized dashboards are in great demand because they are not only attractive, but they can be tailored to suit your particular interests.
React 18 focuses on providing excellent user experience, preventing bottlenecks and enabling quick rendering. Upgrading to React 18 is an easy process when you have the right team. Upgrading is usually a straightforward process, and the existing code shouldn’t break after the upgrade.
Talk to Our Team for Expert Opinion.
Scalan Labs is a full-service product engineering company that provides dedicated teams for full stack development. We have the top1% talent for product engineering and dedicated teams to help you reach your business goals. Contact us today to learn more about how we can help you!


